If you rely solely on price action, a large green candle looks like strong buying, and a massive red candle looks like an imminent market crash. But how often have you bought a strong momentum candle, only for price to instantly reverse against you?
That is the trap of trading price action in isolation. Price tells you what the market is doing, but Volume tells you WHO is doing it.
By introducing Volume Spread Analysis (VSA) into your trading strategy, you can avoid market traps in up to 90% of cases. Whether you are trading forex, gold, crypto, or stocks, VSA allows you to track institutional “Smart Money” footprints in real-time.
What is Volume Spread Analysis (VSA)?
VSA focuses on the relationship between three core elements:
- Spread: The actual size of the candle (from the high of the wick to the low of the wick).
- Volume: The total amount of trading activity/tick count during that candle’s duration.
- Closing Price: Where price closed relative to its high and low (the wicks are critical!).
Understanding Tick Volume
In retail charts (especially Forex), volume bars represent Tick Volume—the total number of orders/transactions executed within that time frame. For example, a volume bar reading 8,000 means 8,000 orders were placed.
While tick volume doesn’t explicitly separate buy orders from sell orders, analyzing the volume bar alongside the spread and closing position of the candle reveals whether institutions were buying or selling.
Selecting Your Timeframe
While VSA applies to all financial markets and timeframes, the 5-minute (5m) and 15-minute (15m) timeframes offer an ideal sweet spot for intraday traders looking to spot clear institutional moves during daily trading sessions.
How to Read Volume: The “Skyline” Approach
Instead of getting bogged down by raw numbers, look at your volume indicator visually—just like scanning a city skyline of skyscrapers:
- Ultra-High Volume: The tallest skyscraper on your chart—the maximum volume seen over approximately 200 to 250 candles. Pay close attention to what price does immediately after an ultra-high volume bar.
- Very High Volume: Exceptionally tall, but not quite an absolute peak.
- High Volume: Noticeably above the moving average of recent volume.
- Range Volume: Average, normal market activity.
- Low Volume: Below average, showing a lack of participation.
- Very Low Volume: “Dead volume”—minimal to no market activity.
Market Dynamics: SOS vs. SOW
Institutional activity leaves behind two primary signals:
- SOS (Sign of Strength): Indicates Smart Money is absorbing supply and preparing to drive prices up.
- SOW (Sign of Weakness): Indicates Smart Money is distributing supply and preparing to push prices down.
Staying Aligned with the Trend
Both SOS and SOW appear in both uptrends and downtrends:
- In a bullish trend, a SOW appears right at the peak before a retracement starts.
- Once the retracement finishes, an SOS forms to signal the resumption of the uptrend.
Pro Tip for High Probability: To keep the odds in your favor, only trade Signs of Strength (SOS) during bullish trend retracements, and only trade Signs of Weakness (SOW) during bearish trend retracements. Avoid taking counter-trend signals!
Deep Dive: Signs of Strength (SOS)
The primary and most powerful Sign of Strength is the Climactic Action Bar. Climactic action comes in two main forms: Selling Climax and Buying Climax.
1. The Selling Climax (Institutional Accumulation)
A Selling Climax occurs at the end of a falling market wave. It marks the exact point where retail traders panic-sell while Smart Money steps in to aggressively absorb (buy) all available supply.
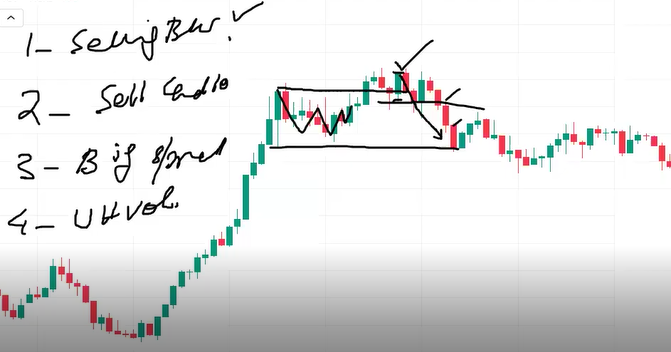
The 4 Strict Conditions for a Selling Climax:
- Selling Background: A clear bearish environment established when the last strong bullish candle is broken down.
- Sell Candle: A down-closing candle.
- Big Spread: A wide-range candle from high wick to low wick.
- Ultra-High Volume: The volume bar must hit peak heights relative to the recent wave duration (200–250 candles).
Golden Rule: If you are ever confused by the candle shape, Ultra-High Volume is the single most critical condition to confirm a Selling Climax.
When a wide-spread sell candle accompanied by ultra-high volume fails to continue pushing lower, it signals that institutions have bought up all the market supply—setting the stage for a sharp bullish reversal.
Summary Checklist for VSA Traders
- Look Beyond Candle Colors: High volume on a red candle often means institutional buying (Selling Climax), not market collapse.
- Scan the Volume Skyline: Always benchmark current volume against the last 200–250 candles to identify true Ultra-High Volume.
- Respect Candle Closes: Always include wicks when measuring spread and note where the candle closes relative to its range.
- Trade with Structure: Only execute SOS setups in bullish trends and SOW setups in bearish trends.