If you want to understand how price moves in any financial market, you need to understand Market Structure.
Market structure is the framework that helps traders identify who is in control—buyers or sellers—and where the price is likely to go next. In this guide, we will break down the absolute basics so you can start reading charts with confidence.
1. The Two Types of Waves
Price never moves in a straight line. Instead, it moves in two primary types of waves:
- Impulse Wave: A strong, fast move in the direction of the main trend.
- Retracement (Correction): A slower, temporary pullback against the main trend.
Key Rule: Impulse waves build the trend, while retracements give traders a second chance to enter the market.
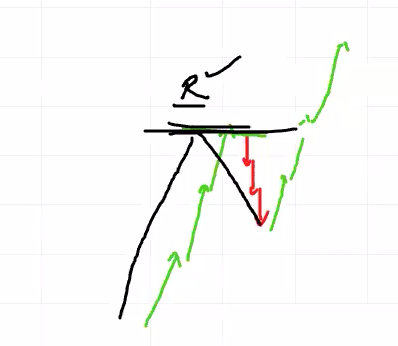
2. Support and Resistance
Think of support and resistance as the floor and ceiling of the price.
- Resistance: A point on the chart where the price stops rising and drops down. (Sellers take control)
- Support: A point on the chart where the price stops falling and bounces up. (Buyers take control)
3. The 3 Types of Market Trends
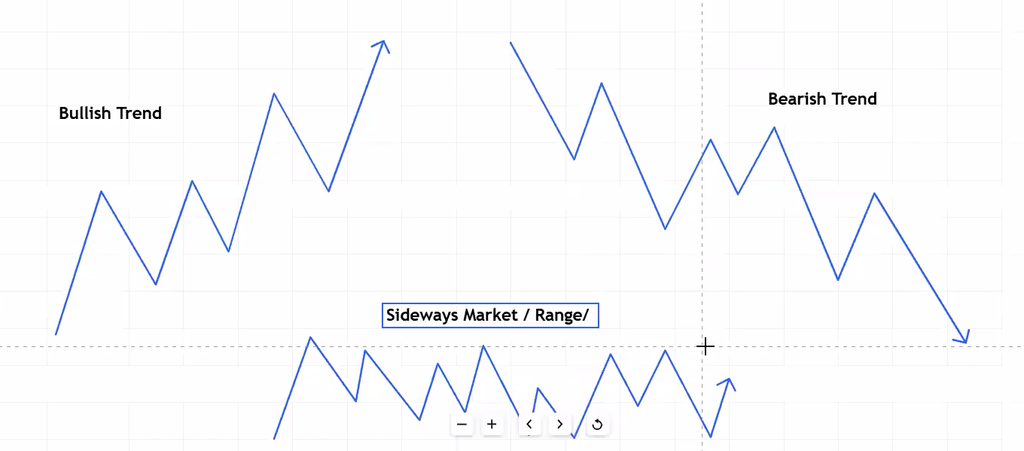
The market can only move in three directions: up, down, or sideways.
Uptrend
In an uptrend, the price keeps breaking higher points.
- Characteristics: Price breaks previous highs while protecting the lows (the lows stay safe).
Downtrend
In a downtrend, the price keeps breaking lower points.
- Characteristics: Price breaks previous lows while protecting the highs (the highs stay safe).
Range (Sideways Market)
A market ranges when it moves horizontally between support and resistance instead of trending.
- Accumulation: When the market ranges before breaking out upward.
- Distribution: When the market ranges before dropping downward.
4. Base Structures inside Trends
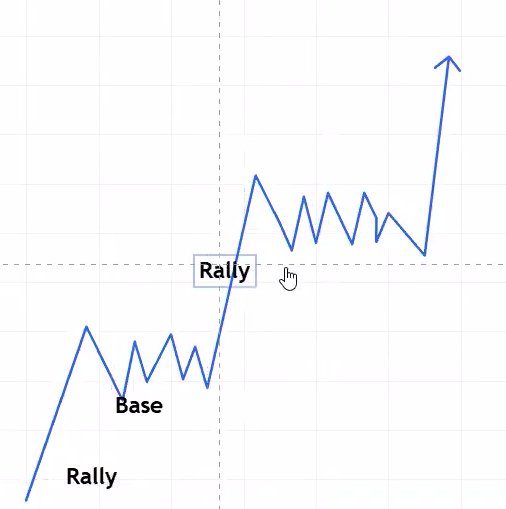
Markets often take a break during a trend. This resting period is called a Base (a narrow range), while the impulse move is called a Rally or a Drop.
- Rally-Base-Rally (In an Uptrend): Price shoots up (Rally), pauses in a sideways range (Base), and then shoots up again (Rally).
- Drop-Base-Drop (In a Downtrend): Price drops fast (Drop), pauses in a sideways range (Base), and then drops again (Drop).
5. How to Properly Mark Highs and Lows
One of the biggest mistakes beginners make is marking highs and lows too early. Here is the strict rule for confirming structural points:
Marking Higher Highs (HH) and Higher Lows (HL) in an Uptrend
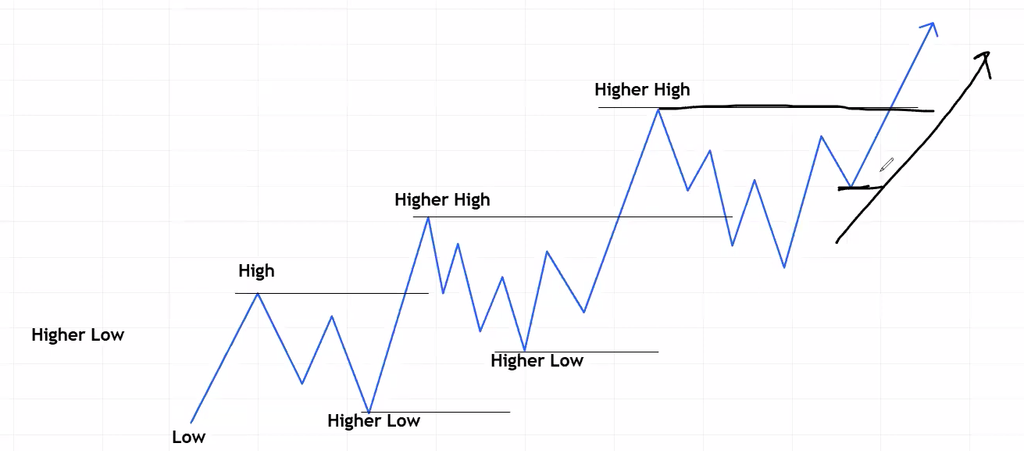
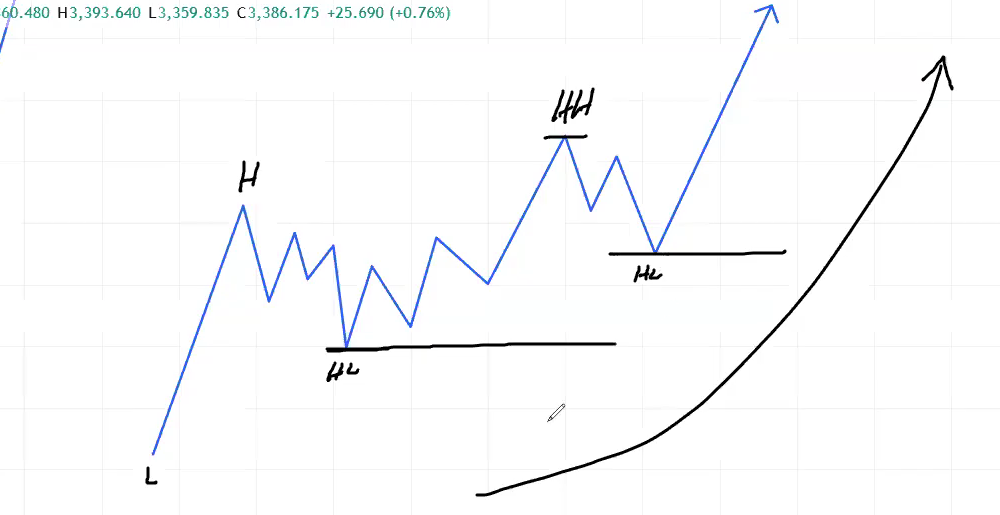
- Higher High (HH): Formed when a valid retracement begins.
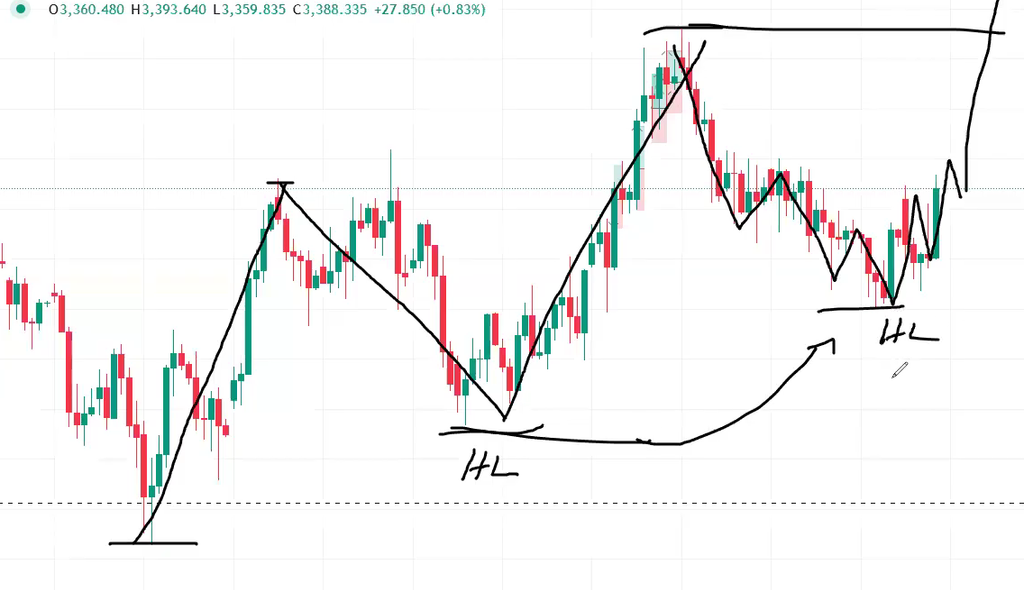
- Higher Low (HL): You cannot confirm a Higher Low until the previous Higher High is completely broken. The Higher Low is defined as the deepest point reached before that breakout occurs.
Marking Lower Highs (LH) and Lower Lows (LL) in a Downtrend
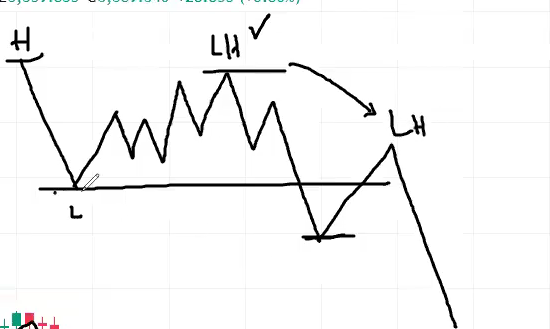
- Lower Low (LL): Formed when a valid retracement begins upward.
- Lower High (LH): You cannot confirm a Lower High until the previous Lower Low is broken. The Lower High is the highest point reached before the breakdown occurs.
Internal Structure Vs External Structure
In uptrend your last confirmed HL must be marked.
We will ignore internal structure. and will focus on external only. in uptrend at always you must mark your latest conform HL
6. What Makes a Retracement “Valid”? (Strict Rules)
Not every minor pullback is a valid retracement. You must use precise rules to distinguish a valid retracement from an invalid one.
Rules for a Valid Retracement (In an Uptrend)
- The Target Level: Find the highest bullish (green) candle at the top of the move. Include its wicks to define its high and low.
- Candle Body Close Below the Wick: A retracement is only valid when a red candle’s BODY closes below the lowest point (wick) of that highest green candle.
- This can happen via a single red candle or a combination of multiple red candles.
- Ignore Inside Bars: Any smaller candle contained completely inside the high and low of the highest independent green candle is an inside bar and must be ignored.
- Invalid Pulldowns: If a subsequent green candle forms but fails to make a higher high and closes within or below the independent candle’s range, ignore it.
[INSERT IMAGE HERE: Diagram showing Valid Retracement (Body Close below Wick) vs. Invalid Retracement]
7. Rules for Marking and Confirming HH, HL, LH, and LL
Once you have identified a valid retracement, you can map out structure points.
Confirming Breakouts (Body Close Requirement)
- To confirm a structural break (e.g., breaking a previous Higher High), a candle MUST close its body above the previous HH level.
- If a candle’s wick spikes above the previous HH but the body closes below it, it is ignored (it is a wick sweep, not a confirmed structural break).
Mapping the Structure Step-by-Step
- Higher High (HH): Formed once a valid retracement begins.
- Higher Low (HL): Confirmed ONLY AFTER price breaks out and closes above the previous HH. The Higher Low is the single deepest point reached before that valid break occurred.
- Lower Low (LL) & Lower High (LH): Applied the exact same way in reverse for a downtrend—LL is marked when a valid pullback occurs, and LH is only confirmed once price breaks down and closes below that LL.
[INSERT IMAGE HERE: Chart showing valid HH/HL markings with Candle Body Breakout confirmations]