Trend lines are one of the most widely used tools in technical analysis, yet most traders draw them incorrectly or take trades on weak, unconfirmed touches.
In the Wyckoff method and Volume Spread Analysis (VSA), a trend line is not just a diagonal line connecting random wicks—it represents the dynamic boundary of market supply and demand.
In this guide, we will cover how to draw trend lines correctly using price action wicks and explain the strict rule required to validate a Wyckoff Trend Line for high-probability retest entries.
1. How to Properly Draw a Trend Line
Before looking for trade setups, you must anchor your trend line correctly.
The Two-Point Rule
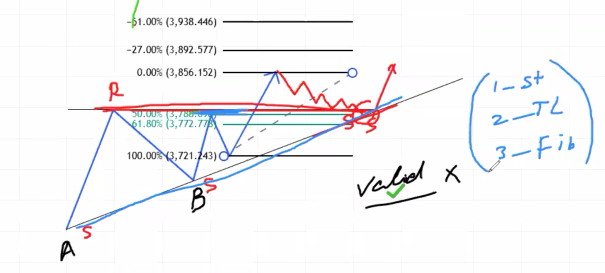
- Point A (Origin): The absolute low (deepest point) at the start of a bullish trend or impulse wave.
- Point B (Structure Low): The next confirmed higher low formed after price makes a new high.
Inclusion of Wicks
In Volume Spread Analysis (VSA), wicks represent real market transactions and liquidity.
- Never cut through candle bodies or ignore long wicks.
- Draw your trend line connecting the outermost tips of the wicks at Point A and Point B, then project (extend) the line outward to the right.
2. The Wyckoff Trend Line Rule
Connecting two points creates a prospective trend line, but it is not yet a valid Wyckoff Trend Line for taking trades.
The Validation Rule:
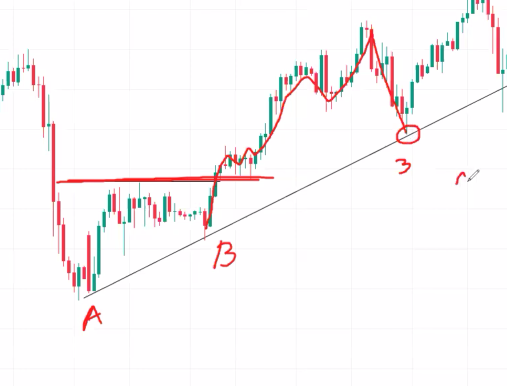
A Wyckoff Trend Line is only valid after the price moves beyond Point B to break structural highs, and then returns down to retest the trend line.
Point A (Origin Low) ───► Point B (Higher Low) ───► Structure Break (New High) ───► Retest Entry
Why This Rule Matters
If you try to trade a trend line while price is hovering around Point B, you are guessing. Requiring price to break above the previous structure high confirms that buyers are actively in control before you take an entry on the pullback.
[INSERT IMAGE HERE: Diagram showing Point A, Point B, a confirmed breakout past Point B, and the subsequent Retest Entry]
3. How to Trade the Retest
Once the trend line is officially validated by a structural breakout past Point B, watch how price approaches the extended line on its return:
- Approach (The Retest): Price falls back down toward the extended Wyckoff Trend Line.
- Volume Behavior:
- The pullback into the trend line should occur on low, declining volume, indicating an absence of real selling pressure.
- If price hits the trend line with massive selling volume, do not enter—wait for absorption or stopping volume first.
- Trigger: Look for rejection wicks, stopping volume, or a lower-timeframe Momentum Shift (CHOCH) right at the trend line boundary.
- Invalidation: Place your stop loss safely below the recent swing structure or below the trend line zone.
4 Setting Your Target (The Channel Rule)
Once you enter on a valid retest of the Wyckoff Trend Line, you need an objective exit strategy. Wyckoff structure makes targeting simple by creating a trend channel.
How to Find Your Target Line:
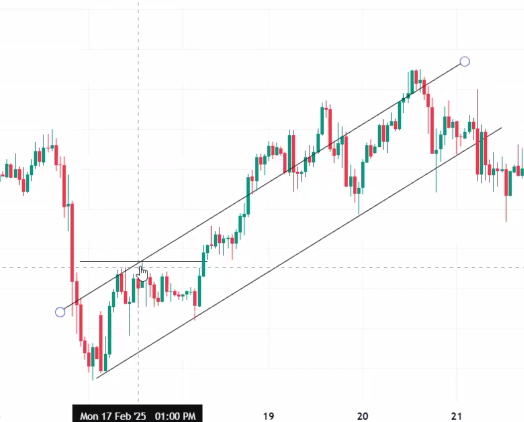
- Copy the Trend Line: Duplicate the exact angle of your validated trend line (Point A to Point B).
- Anchor to the Tops: Drag and place the copied parallel line on the highest wick (swing high) formed between Point A and Point B.
- Project the Target Zone: Extend this top line (the Overbought Line or Return Line) into the future.
trading without evidence can increase losses.
Summary Checklist
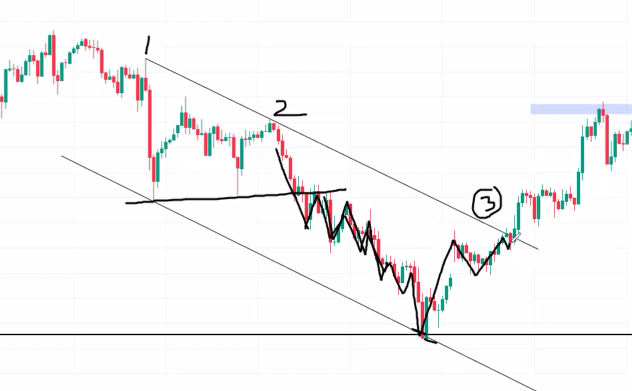
- Identify Point A: The lowest wick at the start of the move.
- Identify Point B: The next confirmed Higher Low wick.
- Extend the Line: Draw through the tips of wicks without cutting bodies.
- Validate the Line: Wait for price to break out past Point B’s high structure.
- Trade the Retest: Enter on low-volume retests back to the extended line.