Understanding Candlestick Charts: History, Anatomy, and Importance in Forex Trading
If you have ever opened a Forex trading platform like MetaTrader or TradingView, chances are you were greeted by a sea of green and red bars. These are candlestick charts, the single most popular tool used by traders worldwide to analyze price action.
Whether you trade major currency pairs like EUR/USD or exotic crosses, understanding how to read candlesticks is essential for navigating the currency markets.
1700s: The Rice Market Era
18th Century
Japanese merchant Homma Munehisa invents candlestick charting to trade rice futures at the Dojima Rice Exchange in Osaka. He realizes market prices are driven as much by trader psychology as by supply and demand.
1980s: Discovery by the West
1980-1990
American trader Steve Nison introduces Japanese candlestick charting to Western technical analysts through his landmark research and bestselling books.
Present: The Standard in Forex
21st Century
Candlesticks become the default visual charting method on virtually all modern financial terminals, Forex platforms, and charting software.
What Is a Candlestick?
A candlestick is a visual representation of price movement over a specific period (e.g., 1 minute, 1 hour, or 1 day). Unlike simple line charts that only show closing prices, a single candlestick packs four vital data points (OHLC) into one clear graphic:
- Open: The price at the start of the timeframe.
- High: The highest price reached during the timeframe.
- Low: The lowest price reached during the timeframe.
- Close: The final price at the end of the timeframe.
Anatomy of a Candlestick
To read a candlestick effectively, you need to understand its core structure:
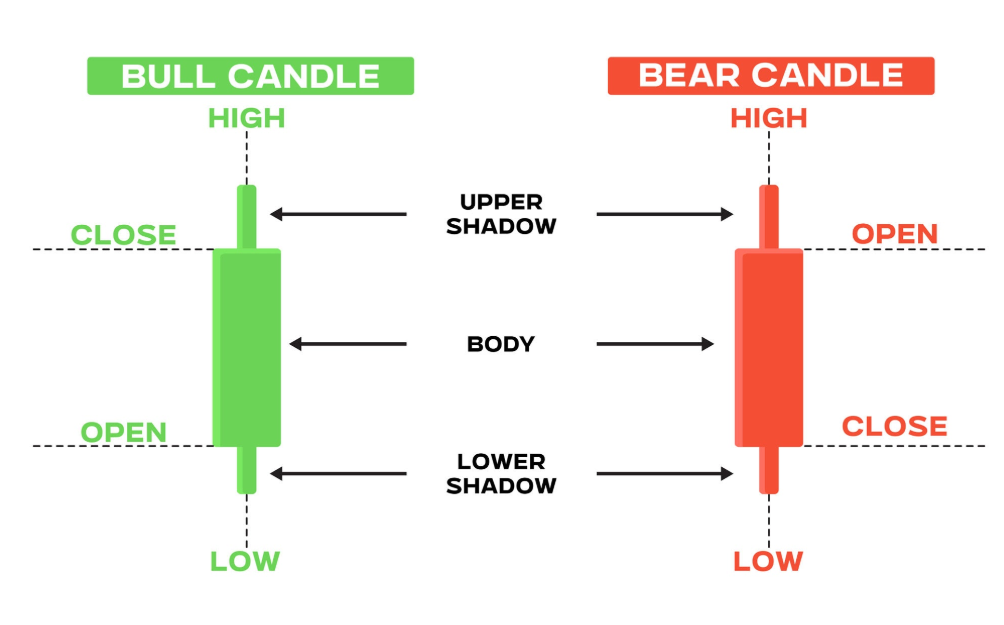
1. The Real Body
The wide central section of the candlestick is called the real body. It represents the price range between the period’s Open and Close.
- Bullish Candle (Green/White): Closes higher than it opened, indicating buying momentum.
- Bearish Candle (Red/Black): Closes lower than it opened, indicating selling pressure.
2. The Shadows (Wicks or Tails)
The thin lines extending above and below the body are the shadows (also known as wicks or tails).
- Upper Shadow: Extends from the top of the body to the High price. It shows how far buyers pushed the price up before sellers pulled it back.
- Lower Shadow: Extends from the bottom of the body to the Low price. It shows how far sellers pushed the price down before buyers brought it back up.
Key Candlestick Patterns in Forex
Traders look for specific single and multi-candle formations to anticipate potential reversals or trend continuations:
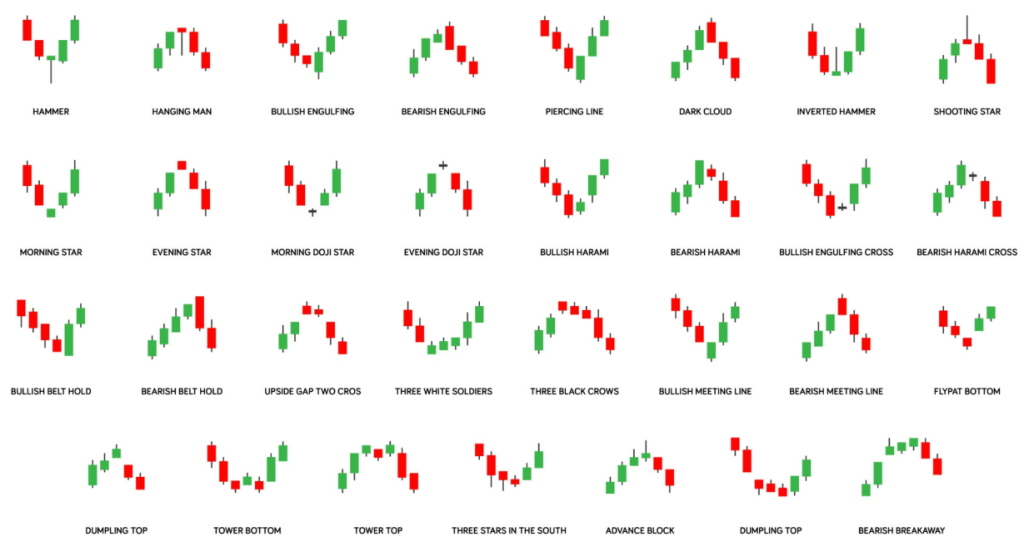
| Pattern Name | Type | Signal | What It Means |
| Doji | Neutral / Reversal | Indecision | Open and Close are almost identical; neither buyers nor sellers are in control. |
| Hammer | Bullish Reversal | Buying Pressure | Long lower shadow after a downtrend; buyers rejected lower prices. |
| Shooting Star | Bearish Reversal | Selling Pressure | Long upper shadow after an uptrend; sellers rejected higher prices. |
| Engulfing (Bull/Bear) | Reversal | Strong Momentum | A large candle completely covers the real body of the previous candle. |
Why Candlesticks Are Essential in Forex Trading
1. Visualizing Market Sentiment At a Glance
A simple glance at a candlestick chart tells you who is winning the tug-of-war—buyers (bulls) or sellers (bears). A long green body shows dominant buying pressure, while long wicks highlight price rejection levels.
2. Highlighting Key Support and Resistance
The upper and lower wicks pinpoint precise price levels where the market reacted strongly. These high and low points help Forex traders draw reliable support and resistance levels.
3. Early Warning Signal for Reversals
Unlike lagging indicators (such as moving averages) that take time to react, price action candlestick patterns provide real-time warnings when an ongoing trend is losing momentum.
4. Works on Any Timeframe
Whether you are a Forex scalper looking at 5-minute charts or a swing trader evaluating daily charts, candlestick principles remain identical across all time horizons.
Summary
Mastering candlestick analysis is one of the most effective skills you can build as a Forex trader. By learning to interpret what the body length, wick size, and candle color tell you about market psychology, you can make far more informed entries and exits in the currency markets.