Support and Resistance (S/R) is one of the most fundamental concepts in technical analysis. While beginner price action traders often rely heavily on it, experienced traders recognize that basic S/R levels are highly manipulated by market liquidity.
S/R is a foundational tool to help mark your Point of Interest (POI)—not a standalone entry signal.
What is Support and Resistance?
- Support: A price level or zone where buying pressure overcomes selling pressure, causing the price to stop falling and rise.
- Resistance: A price level or zone where selling pressure overcomes buying pressure, causing the price to stop rising and drop.
Strong vs. Weak Levels
- Strong S/R: Levels where the price has reacted sharply or stayed consolidated for a long duration. Higher timeframes (like the 4-Hour chart) create significantly stronger S/R zones than lower timeframes.
- Weak S/R: Levels on lower timeframes with minimal touches or short consolidation periods, which break easily.
Role Reversal (Flip Levels)
When a level breaks, its function flips:
- Resistance Turning into Support: In an uptrend, when price breaks above a resistance level, that former ceiling becomes a new floor (Support).
- Support Turning into Resistance: In a downtrend, when price breaks below a support level, that former floor becomes a new ceiling (Resistance).
The Confirmation Test: For a resistance level to truly convert into support, price must stay above it. If price breaks back down, it must immediately close a candle back above the level. Without a confirmed candle body close above, the resistance has not converted into support.
How to Properly Mark S/R Zones
Avoid drawing thin horizontal lines. Instead, draw rectangular zones:
- Wide Area (Standard): Draw a rectangle from the highest candle body to the tip of the longest wick across the level on higher timeframes (e.g., 4H).
- Refined Zone: To narrow down an overly wide 4H zone, reduce the height of your rectangle to cover the highest density of wick/body touches.
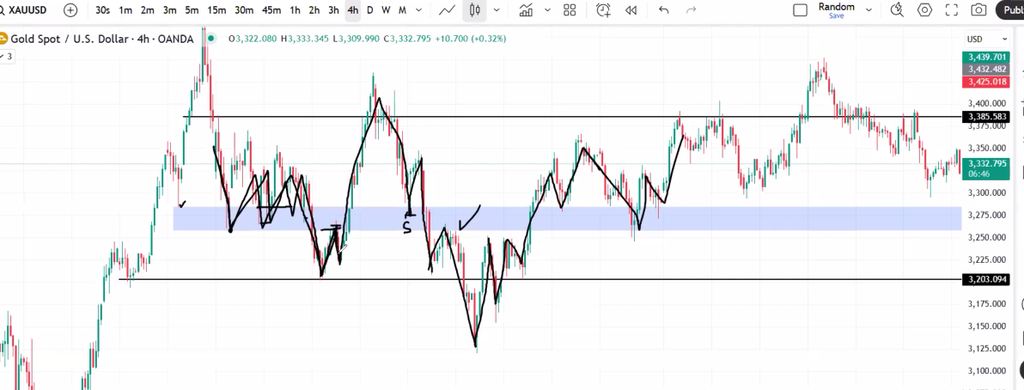
The Rule of Valid Breakouts (Filtering Noise)
To prevent getting caught in fakeouts or liquidity sweeps, use the strict price action candle closure rules:
Multi-Candle Confirmation Rules
- 15-Minute Level: Needs 4 consecutive 15-minute candles OR 1 full 1-Hour candle closing beyond the level.
- 1-Hour Level: Needs 4 consecutive 1-hour candles OR 1 full 4-Hour candle closing beyond the level.
Single-Candle Exception (Volume / Absorption)
A single candle break is only valid if accompanied by high volume (Absorption Candle), signaling that institutional orders have absorbed all liquidity at that boundary.
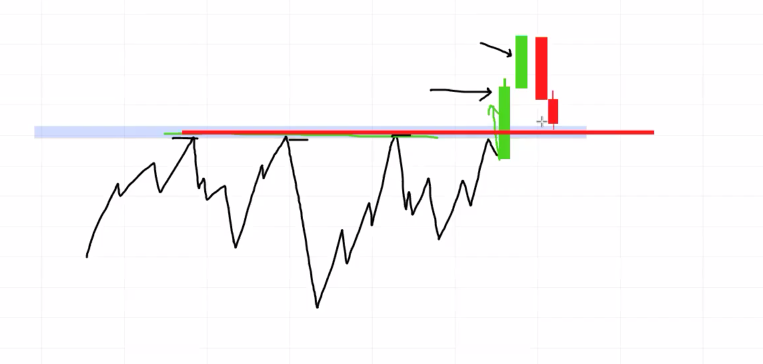
Why Basic S/R Fails (And How to Fix It)
Trading simple retests of S/R levels is highly risky because institutional market makers often target liquidity sitting right above or below these obvious levels.
Better Confirmation Tools
Instead of blindly buying or selling at S/R zones, use these tools to confirm institutional presence:
- Fair Value Gaps (FVG): Look for a Fair Value Gap created right during the breakout of an S/R level. An FVG inside a breakout signals real institutional momentum.
- Volume Analysis: Ensure high volume backs the breakout to avoid getting caught in a low-volume trap.
- POI Framing: Treat S/R zones purely as a Point of Interest (POI). Wait for a lower-timeframe Change of Character (CHOCH) inside the POI before taking an entry.
Timeframe Dynamics & Market Behavior
- Lower Timeframe Noise: On 5-minute charts (e.g., in volatile assets like Gold), market noise can offer quick 30–40 pip moves without breaking structure levels.
- Asset Tendencies: Assets like Gold tend to maintain strong macro uptrends; even after steep corrections, higher timeframe S/R boundaries frequently act as prime demand POIs rather than trend-reversal signals.
Summary Checklist
- Use S/R to locate your Point of Interest, not to blindly execute trades.
- Demand candle body closures (or absorption volume) to validate true breakouts.
- Combine S/R boundaries with FVGs, Volume, and ICT concepts for high-probability trade setups.