Finding Golden Entries and Setting Targets
The Fibonacci Retracement tool is one of the most popular technical analysis indicators in trading—yet many beginners misuse it. They apply it randomly across charts, draw it in ranging markets, or blindly enter trades without confluence.
When used correctly during a clear trend, Fibonacci retracement helps you pinpoint high-probability entry zones (the Golden Zone) and projected profit targets (Take Profit levels).
1. Prerequisites: Where and When to Apply Fibonacci
Fibonacci is not a standalone magic bullet. To get accurate results, follow these structural rules:
- Trending Markets Only: Fibonacci only works in a trending market. Never apply it during a horizontal range or consolidation.
- Apply on the Impulse Wave: Draw the tool from the start of an impulse wave to its end (including wicks). While you can draw from a Higher Low (HL) or Lower High (LH) after a break of structure, prioritizing the true origin of the impulse wave gives the cleanest levels.
- Wait for the Retracement to Start: Do not draw Fibonacci while the price is actively making a new high or low. Wait until the move stalls and a valid retracement begins.
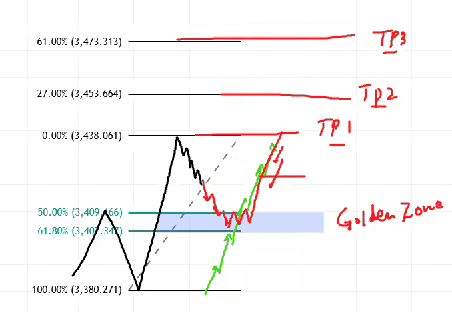
2. Setting Up Your Fibonacci Tool
Clean up your chart by hiding unnecessary levels. Use these simplified settings:
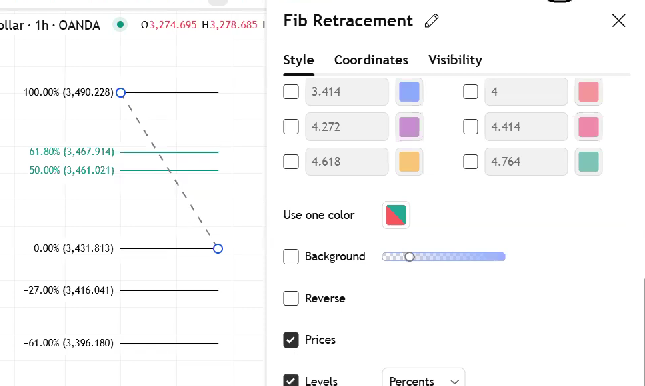
| Level | Purpose | Color |
| 0.0 | End of Impulse Wave (Recent Swing High/Low) | Black |
| 0.5 | 50% Equilibrium Level | Green |
| 0.618 | Golden Ratio Level | Green |
| 1.0 | Start of Impulse Wave (Origin) | Black |
| -0.27 | Take Profit 2 (TP2) | Black |
| -0.618 | Take Profit 3 (TP3) | Black |
Display Settings: Set levels to display as Percentages, turn off the background fill to keep your chart clean, and leave price labels turned On.
3. The Golden Zone (0.50 – 0.618)
The area between the 50% and 61.8% (0.618) retracement levels is known as the Golden Zone. This is your primary Point of Interest (POI) for entering trend-continuation trades.
To mark this zone:
- Draw a rectangular box spanning from the 0.50 level to the 0.618 level.
- Look for price action signals (like candlestick patterns or momentum shifts) inside this box before entering.
4. Confluence: Combining Fibonacci with Fair Value Gaps (FVG)
While the Golden Zone is powerful on its own, a Fair Value Gap (FVG) carries higher structural weight than Fibonacci alone.
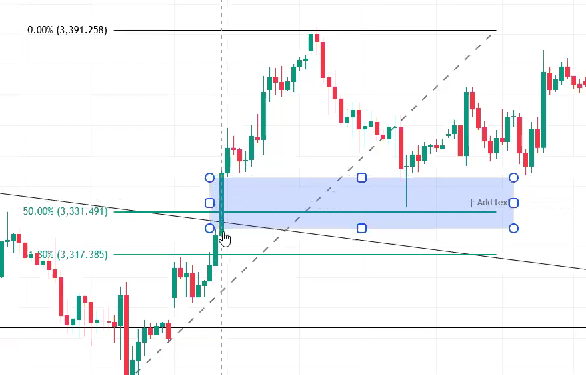
- If an FVG sits right next to or inside the Golden Zone: Expand your highlighted zone to include the entire FVG area.
- Institutional Behavior: Price will almost always react directly off the FVG rather than strictly touching the 0.50 or 0.618 line. Prioritize the FVG for your entry trigger.
5. Setting Take Profit Targets (TP1, TP2, TP3)
Fibonacci retracements also provide predefined profit targets based on probability.
Target 1 (TP1) — The 0% Level (High Probability)
- Hit Rate: ~90%
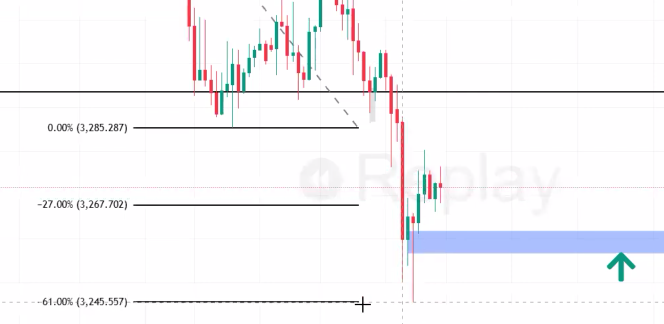
- Execution Rule: Because Fibonacci levels use wicks, set your TP1 order just before the actual 0% wick high/low by focusing on where candle bodies close. Closing out partially at the bodies protects profits before a potential wick sweep.
Target 2 (TP2) — The -0.27 Level (Medium-High Probability)
- Hit Rate: ~70%
- Execution Rule: This is your primary extension target after price breaks past the previous impulse high or low.
Target 3 (TP3) — The -0.618 Level (Lower Probability)
- Hit Rate: Lower accuracy (~40–50%)
- Execution Rule: Use TP3 for trailing stops or runner positions during strong, high-momentum trends.
Summary Checklist
- Confirm the trend: Avoid ranging markets completely.
- Anchor the impulse wave: Include wicks from start to finish.
- Box the Golden Zone: Highlight 50% to 61.8%. Adjust for nearby FVGs.
- Target realistically: Take major profits at TP1 (0%) and TP2 (-0.27%), leaving a small runner for TP3 (-0.618%).