Moving averages are among the most widely used technical indicators in trading. However, a common mistake beginners make is treating them as an “all-in-one” trading strategy.
In reality, moving averages cannot be used as a standalone entry signal. They are basic, lagging indicators that market makers and automated algorithms frequently manipulate to trap retail traders.
When used correctly, moving averages serve as an excellent helping tool—giving you a quick snapshot of trend direction, market dynamic support/resistance, and trade management guidance.
1. What is a Moving Average?
A Moving Average calculates the average closing price of an asset over a specified number of past candles (periods).
For example, a 9-period Exponential Moving Average (9 EMA) calculates the weighted average price of the last 9 candles from their lowest to highest closes.
Simple Moving Average (SMA) vs. Exponential Moving Average (EMA)
- SMA (Simple Moving Average): Weights every candle in the lookback period equally.
- EMA (Exponential Moving Average): Gives significantly more weight to the most recent candles.
Preference: Always prefer EMAs over SMAs. Because EMAs react faster to recent price action, they reduce lag and provide cleaner structural signals.
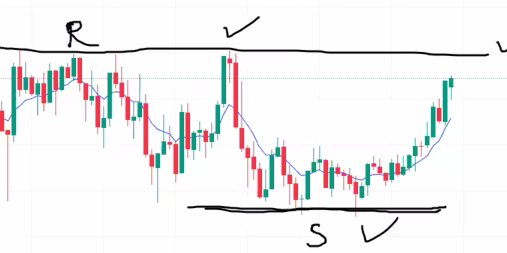
2. Dynamic Support and Resistance
While classic support and resistance levels are drawn horizontally and trend lines are drawn diagonally, moving averages act as dynamic support and resistance.
- In an uptrend, price often bounces off the moving average line as dynamic support.
- In a downtrend, the moving average acts as a dynamic ceiling (resistance).
The Reality Check: Accuracy & Manipulation
Just like traditional horizontal support and resistance, moving average levels have low accuracy on their own. Institutional algorithms regularly breach or “wick” through moving averages to grab liquidity before continuing the true move.
Never place a trade simply because price touches a moving average line. Use them as an secondary point of context, not your primary entry trigger.
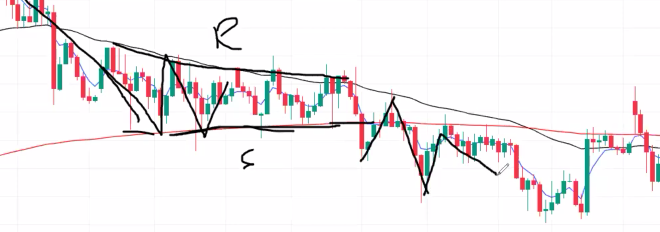
3. The 3-EMA Trend Ribbon Setup
To quickly identify the trend and gauge market momentum, set up a Moving Average Ribbon using three key EMAs:
| EMA | Line Color | Purpose & Role |
| 5 EMA | Blue | Weakest importance; tracks immediate, aggressive trend momentum. |
| 50 EMA | Black | Short-to-medium term trend direction. |
| 200 EMA | Red | Long-term macro trend boundary. |
Timeframe Rule: When using moving average ribbon setups for short-term technical analysis, stick primarily to higher timeframes or limit lower timeframe analysis to 5-minute charts to reduce market noise.
4. How to Read Trend Alignment and Volatility
By observing the order and distance between these three EMAs, you can instantly determine market conditions:
Bullish Alignment
- Order: The 5 EMA (Blue) is on top, followed by the 50 EMA (Black) in the middle, and the 200 EMA (Red) on the bottom.
- Strength: The wider the gap between the EMAs, the stronger the bullish momentum.
Bearish Alignment
- Order: The 200 EMA (Red) is on top, followed by the 50 EMA (Black), and the 5 EMA (Blue) on the bottom.
- Strength: A widening fan shape confirms an accelerating sell-off.
Ranging Market (No Trade Zone)
- When all three EMAs cluster tightly together or cross back and forth repeatedly, the market is ranging. This is a clear warning sign to stay out of the market.
[INSERT IMAGE HERE: 3-EMA Ribbon — Strong Trend (Fanned Out) vs. Ranging Market (Clustered Together)]
5. Trade Management: Using the 5 EMA as a Trailing Stop
While you shouldn’t use EMAs to open trades, the 5 EMA is a powerful tool for managing active trades.
If you are already in a short (sell) position:
- As long as price candles remain below the 5 EMA, the downside momentum is intact—you can safely hold the position.
- When a candle breaks and closes above the 5 EMA, momentum is fading, signaling an optimal time to exit or lock in profits.
Summary Checklist
- Treat EMAs as context, not entries: Use them to filter trends, not to trigger buy/sell orders.
- Identify the macro trend: Look for clean alignment between the 5, 50, and 200 EMAs.
- Avoid choppy ranges: Never trade when the 5, 50, and 200 EMAs are squeezing close together.
- Manage active trades: Use the 5 EMA as a dynamic trailing guide to stay in trending moves longer.